
Metropolitan growth is an important drive in urban planning and real estate development. So, in the real estate research, it can help to explain the background or the foundation of next trend in real estate market. There are five major forces conveying key information in real estate.
Competition Indicators
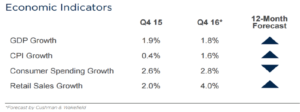
GDP
Why it is important?
No matter in global market or local market, competition of a market stands for its economic power and indicates its current position and future potential. Therefore, GDP is frequently referred in the beginning of general research reports.
Strengthens/ Weakness
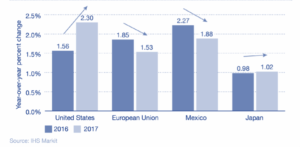
For example, in the Q3 of 2016 real GDP expanded at a 3.5% annual rate which is the strongest growth rate in two years and more than triple the rate of growth for the first half of 2016. But the flaw is that GDP is too generic to support a deep research, especially for a specific area or period.
Resources
World Bank (data.worldbank.org) can provide information about GDP by countries.
Exchange Currency Rate
Why it is important?
From an international scope, exchange currency rate is a significant indicator of attractions to the (overseas) investors.
Strengthens/ Weakness
While its weakness is that currency would be a double-edged sword. When the dollar continues to strengthen against a basket of foreign currencies, that sword will cut the foreign investors out.
On the one hand, foreign buyers increase the diversity of the potential homebuyer pool, pushing up the demand that can be very helpful in minimizing the effect of localized recessions on housing markets. But affordability and inventory can suffer – particularly in very desirable urban areas, if foreigners purchase homes in the U.S. without the intent of relocation, thereby removing these properties from the market. So, when using exchange currency rate in research, its two sides of effects must be considered.
Resources
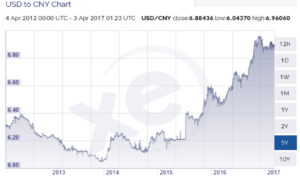
Exchange currency rate can be obtained by international finance websites or currency information website, e.g. XE (http://www.xe.com) where you can review the currency chart for selected periods.
CPI
Why it is important?
In a nationwide, CPI inflation can be seen as a consequent reaction after exchange currency rate. A strong domestic currency can decrease the inflation rate in a nation, because of lower prices for foreign products. A study of the correlation between various asset classes and inflation shows that real estate returns have the highest correlation.
Strengthens/ Weakness
While in the real economy, there are a lot more factors that affect house prices and the correlation is not as prominent as in our example. So for a thorough research, these factors and their chain reaction cannot be ignored.
Resources
Information about these indicators can be obtained from most major financial or research websites and US Department of Commerce, Bureau of Economic Analysis.
Capital Cost Indicators
Interest Rate
Why it is important?
Continued to the previous economic indicators, capital cost is also a major concern for real estate investment. The most direct indicator is the interest rate which is critical in the finance and evaluation of any investment primarily because of their impact on the present value of future cash flows and current mortgage. When the interest rates go up, the monthly payment increases and the value of any future cash flow decreases, which in turn lowers the value of the asset.
Strengthens/ Weakness
However, interest rates never change alone, so it is useless to analyze the potential effects on real estate value without thinking about the other factors that may occur in tandem with changing rates.
Resources
Interest Rates are various from lenders, where we may get information directly. But the most common one is the Federal Funds Rate which can be obtained from Federal Reserve. There are also some prime rates can be reliable references, such as WSJ Prime Rate or LIBOR.
10-year treasury yield
Why it is important?
Another indirect indicator – 10-year treasury yield is also drawing attention from investors and researchers. And treasury yields are related directly to mortgage interest rates, which affect home buying and refinancing decisions. Usually, treasury bonds are benchmarks for mortgage and other loan rates because they are risk-free assets. There is a strong correlation between mortgage interest rates and Treasury yields, according to a plot of 30-year conventional mortgages and 10-year Treasury yields using Federal Reserve Economic Data. The other reason 10-year treasury yield became an economic indicator in real estate is because many investors have been laser-focused on how a rise in US Treasury rates could trigger a rise in cap rates, and therefore a fall in real estate values.
Strengthens/ Weakness
Upon Morgan Stanley’s technical analysis, the correlation between cap rates and Treasury rates turns out to be tenuous. This suggests that other key variables may influence cap rate movements and real estate which need a deep exploration.
Resources
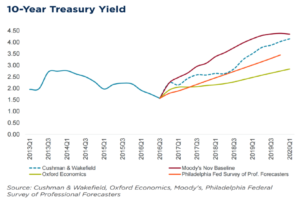
For 10-year treasury yield, most finance websites (e.g. yahoo, Cushman & Wakefield, Oxford Economics, Moody’s) can offer accurate information.
Investment Sales
Why it is important?
From the perspective of market volume, investment sales can indicate the dynamic in the real estate market which including office, retail, industrial, multifamily, hotel and lands. While the peak year of sales activity in this cycle was 2015 (at $546.3 billion), it never surpassed the previous peak year of 2007 ($569.9 billion). This was a function of many factors, including pre-election jitters along with a sharp move upwards in Treasury yields which had many investors pausing and recalibrating. Key players are also a part of this indicator. Like the largest players in the market—private equity and institutional investors—grew their investments in commercial real estate modestly in 2016. These two types of buyers accounted for more than 70% of asset purchases. So this indicator can help researcher or investors forecast the next quarter or year, also track the major player in the market.
Strengthens/ Weakness
But for any specific type of real estate or area, the total investment sales cannot help with identifying the internal changes and future trends.
![]()
Resources
While the total volume of investments sales can be obtained from RCA, NCREIF, Moody’s Analytics and other major real estate or finance consulting websites.
Industries Indicators
To solve the problem of internal changes, it is necessary to track related industries to see how it influence real estate market. And it also shows the economic structure which could be healthy or unhealthy, traditional or innovative.
Technology
Why it is important?
The first industry indicator could be technology. Silicon Valley is a typical example which can refer to all high-tech businesses in the region. The term is now generally used as a synecdoche for the American high-technology economic sector and became a global synonym for leading high-tech research and enterprises. In real estate, it is also like a landmark which developed and boomed with technologies. So this area has an innovation and advanced economic structure, and it would definitely attract investors or developers to create spaces for them to live, work and shop.
Strengthens/ Weakness
There are some major indexes can be indicators for the technology industry, like the S&P 500 Information Technology Index, which comprises those companies included in the S&P 500 that are classified as members of the GICS information technology sector. The tendency is remaining positive, but this indicator is too generic like GDP, only shows a simple impression. For a specific research, there would need a more statistics analysis for technologies companies.
Resources
S&P 500 or NASDAQ can offer industry indexes which are more reliable and updated.
Retail
Why it is important?
With the rapid growth of Information Technology, there is another topic – E-Commerce which is often brought up to compare with traditional retail. For the whole retail industry, consumer spending growth is an important indicator for researcher and investors to evaluate the whole market performance. In 2016, retail closures and bankruptcies were up significantly, and over 4,000 major chain closures were tracked, a figure that surpassed 2010’s record 3,600 shuttered major chain storefronts. In addition, there were 26 major U.S. retailer bankruptcies during 2016 compared to 22 in both 2015 and 2014. Therefore, a few major retail categories will be contracted, while other sectors that have been growing will increasingly face issues of market saturation that will slow expansion. Contraction from department store chains and high-profile apparel in 2017 will mostly impact mall and lifestyle center properties. However, the anticipated atmosphere of uncertainty may negatively impact publicly traded brands beyond those categories. On the whole, neighborhood/community and power centers will perform best with the least exposure to contraction, while the impact of these trends on mall and lifestyle centers will be disproportionately felt by Class B and C properties, particularly those in secondary or tertiary markets. Although this information is not direct with the retail tenants or landlords, it can impact investors’ decision and the retail real estate market from its rent, absorption and vacancy. In this case, retail sales should be an indicator to reflect the changes in traditional retail market.
Strengthens/ Weakness
However, with a larger share of that spending going to eCommerce. This indicator only can reflect consumers’ buying power, but cannot be analyzed for traditional retail or e-commerce.
Resources
Cushman & Wakefield and similar real estate service companies offer detailed reports for retails and shopping centers by locations.
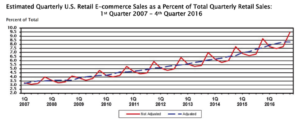
E-Commerce
Why it is important?
Like mentioned before, a large share of retail sale is going to eCommerce. With that said, the demand of warehouses and distribution centers will increase, then industrial real estate will continue to benefit from this growth. So the eCommerce sales can be another industry indicator.
Strengthens/ Weakness
But due to its limitations, it may only apply to specific research in industrial real estate.
Resources
E-commerce sales information can be obtained from US Department of Commerce.
ISM Manufacturing Index
Why it is important?
There is another commonly used industry indicator for research in industrial real estate — ISM Manufacturing Index. The ISM manufacturing index is based on surveys of 400 purchasing managers nationwide regarding manufacturing in 20 industries. The index has a strong correlation with manufacturing industrial production and provides timely information on manufacturing.
Strengthens/ Weakness
The ISM index is also a good leading indicator of the economy and is useful in gauging turning points in the business cycle. However, ISM index does not capture technological change and production efficiencies, which make it possible for production to expand while employment contracts.

Resources
ISM Index, as a common index industrial business, can be obtained from Institute for Supply Management directly or related industrial reports.
Demographic Indicators
Why it is important?
Demographic are the data that describes the composition of a population, such as age, race, gender, wage, migration patterns and population growth. These statistics are an often overlooked but significant factor that affects how real estate is priced, what types of properties and the major age group are in demand. Major shifts in the demographics of a nation can have a large impact on real estate trends for several decades like baby boomers and “two-child” policy. Increased population requires more housing, shopping, working (which includes both factories and office buildings) and more hotels for recreation.
Strengthens/ Weakness
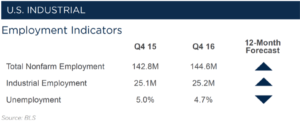
However, the number of the population growth cannot explain the inside population structure. So following the previous industry indicators, besides indicators like age, race or gender, demographic indicators would include the total employments and employments in different industries in this case. The first common index is non-farm employment which represents employments working the secondary and tertiary industries who would take up most commercial real estate in the market. But it is not detailed enough to support further research. So, the office-using employment would be an important indicator for office while industrial employment would indicate the quantity of labor in industrial real estate. These specific industry employments can indicate the expansion or contraction of the industry, then indicate its demand/supply in real estate.
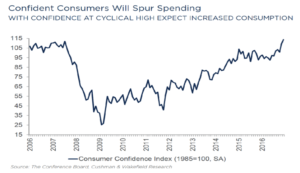
While the income in any specific areas can translate into consumers’ confidence index which indicate consumers’ buying power and the affordability of housing.
Overall, demography is a critical driver of real estate demand with the population growth, including immigrants. In 2015, in 44 million immigrants living in the United States. At the current pace, the foreign-born population will grow to 52 million by 2025—more than one of every seven residents.
But most immigrants have their preferences in locations, so the significance of this indicator may work for a few cities which attract immigrants rather than the whole country.

Resources
Demographic data can be obtained by U.S. Bureau of Labor Statistics.
Relocation Demand Indicators
Why it is important?
Besides the population growth, there are some factors impact real estate demand, such as relocation.
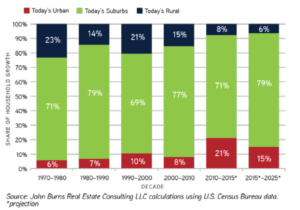
One of the most common reason is retirement. The traditional labor pool of the working-age population 20–64 will grow much more slowly over the next decade, which means slower job growth and rising wages. From ULI data, the retirement surge over the next decade means that by 2025, the number of people leaving the labor pool (the total number of people ages 20–64) will almost equal the number entering it. ULI also predicts Household growth over the next decade will tilt heavily south, toward the “affordable sunshine states” of the Sun Belt: Florida, Texas, the Southeast, and the Southwest. So the retirement indicators are significant in relocation and senior housing/Health Care research.
Returning suburban growth is one of the relocation trends. Urban areas, which tend to have less room to build, higher prices, and fewer desirable schools, will capture 15 percent of household growth, modestly boosting cities’ share of the total number of households. Many suburban cities created decades ago that are now largely built out continue to reinvigorate themselves with vibrant suburban downtowns composed of new retail and residential developments. In suburban areas, home size, privacy, housing affordability, and kid-friendliness feel more urban than suburban, while school quality, public transportation, and proximity to employment feel more suburban. Because both cities and consumers want retail that is walkable from housing, retail and residential developers should work closely to create cohesive developments to satisfy this evolving consumer. An 86 percent surge in household formations to 12.5 million households over the coming decade in comparison with the prior decade will drive purchases in all stores that cater to new households, particularly renters, who will constitute 58 percent of the net new number of households.
Another relocation trend is the shift to sharing and experience economy. The new sharing economy, which includes more opportunities to rent or borrow than ever before, will most certainly affect household formation and spending patterns. The well-known examples are Airbnb and WeWork, which hit the hotel market and traditional office market representatively.
Strengthens/ Weakness
While these trends are still in the process, so it might be difficult to track timely in research.
Resources
Information for these relocations can be obtained in Urban Land Institute.
Valuation Indicators
Average Asking Price
Why it’s important
The average asking price for a comparable property type should provide a loose guideline for the feasibility of a proposed project. If you are able to achieve your target revenue with projected prices that are in line with average asking prices, your project has passed an important test and may be viable.
Strengths/Weaknesses
This does not take costs into consideration, so has only limited utility on its own. Ideally, one is able to achieve their target return by combining this figure with a conservative expense budget. There is also the risk of comparing asking prices with properties that have underlying difference. For instance, a condominium may be a near perfect match physically, but one association may be in a much worse financial situation than the other and can expect substantially higher HOA fees. An additional risk worth stating is that there may be a lack of substitutable inventory. This lack of data may lead to unrealistic projections.
Resources
The multiple listing service and an experienced broker will generally understand the local market dynamics. If feasible, a boots on the ground approach allow you to identify competing product and interact with tenants in the area. Ideally you are in a position to cherry pick the most desirable aspects for your own projects.
Historical Sale Price Trends
Why it’s important
In order to forecast appreciation rates, it is helpful to understand historical trends. While momentum is not a guarantee of future performance, it can help you identify markets which may be overheated and which markets may be undervalued.
Strengths/Weaknesses
Black swan events are not captured with historic data. Over-reliance on historic trends can lead to undue risk for a project.
Resources
While the multiple listing service is a solid resource for residential properties, commercial transactions tend to be more opaque. The county recorder or local property tax office generally keeps a copy of the deed, as well as any mortgage notes on file. This information is often available online direct to the public or through third party data aggregation services.
Cap Rates
Why it’s important
Cap rates can indicate a number important characteristics about a project. A cap rate is calculated dividing the net operating income by the purchase price of the asset. One key use of cap rates is price setting. Knowledge of cap rates on comparable projects can help you to project the value of your project, given a projected net income. In general, a lower the cap rate should indicate a less risky cash flow projection. Projects with inherent challenges, should produce a higher cap rate. These challenges can include high vacancy rates, high crime and lack of investor demand.
Strengths/Weaknesses
Cap rates can be analyzed with and without leverage. Because each loan has unique terms and characteristics, a levered cap rate can distort the underlying nature of the project. However, unlevered cap rates do not reflect the unique impact debt service can have on a particular project. Since cap rate data can often be difficult or impossible to come by, one can alternatively look to the gross rent multiplier (GRM). This figure is derived by dividing the purchase price by the gross rents. This obviously has less value in one’s analysis due to the lack of expense figures. Other issues with cap rates include lack of knowledge of non-property inclusions in the sale and the use of projected vs. historic income.
Resources
The authoritative source for cap rates has been the Korpacz Real Estate Investor Survey. Knowledgeable local brokers are usually your best alternative to costly data subscriptions like Korpacz.
Competing Supply
Why it’s important
Knowledge of alternatives or substitutes for your product are key to understanding the local market dynamics of supply and demand. This understanding will aide you in setting pricing, incentive offerings, and whether a market can support the project you have planned.
Strengths/Weaknesses
Real estate is known for being a heterogeneous asset type. You will never find a perfect substitute, as each plot of land is unique in its precise location. In addition, you will find differences in the age of various components, layouts, styles, construction materials and more. One must compensate for this by adjusting for differences when comparing.
Resources
The multiple listing service and an experienced broker will generally understand the local market dynamics. If feasible, a boots on the ground approach allow you to identify competing product and interact with tenants in the area. Ideally you are in a position to cherry pick the most desirable aspects for your own projects.
Cost Indicators
Wages, Labor costs & Job Markets
Why it’s important
When conducting due diligence and creating your project proforma, wages, labor costs and the job market can weigh heavily on your expected returns.
On the revenue side of your income statement, changes in these markets can impact your rent inflator, bad debt rates and vacancy rates. To cite one of the more dramatic recent examples, have a look at the building boom in North Dakota, fueled by high oil prices and the requisite demand for labor. With the decline in oil demand, the result is a glut of homes on the market, shuttering businesses and over-leveraged local governments. Not a recipe for a healthy real estate market.
On the expense side, labor costs commonly make up a disproportionate amount of real estate development costs. Typically 45-50% for of the budget for commercial projects, with unionized labor, costs can be 20 to 25% higher.
Strengths/Weaknesses
Labor and wage indicators are an important component of market research, but should be taken in context. What would it look like if we saw a geographic area with a sudden increase in U6 (underemployment)? Is this a sign of a weakening economy or an aging population working fewer hours?
Resources
| Source Name | Link |
| Bureau of Labor Statistics | Regional Data. NYC. |
Construction Material Costs
Why it’s important
After acquisition and labor costs, your next largest development project cost is likely to be construction materials. Various factors can influence these costs, luckily, the Bureau of Labor Statistics compiles this information on a regular basis. In a large project, small changes can have a big impact.
Strengths/Weaknesses
To the extent a project relies on a volatile commodity component, the developer can purchase insurance in the form of futures contracts for that good. Additionally, when considering which materials to use, a developer should consider the risk of functional obsolescence. Functional obsolescence accelerates the effective depreciation of your building components as the result of a more desirable substitute good. This can be caused by technological innovation in energy efficiency, fire safety or a number of other building features in high demand. The result could be higher than expected vacancy rates at your project.
Resources
The Bureau of Labor Statistics collects and publishes data on the producer price index (PPI). This includes regional PPI data which is further separated into various construction industry components. There is also census related data available at: https://www.census.gov/construction/.
Supply & Demand Indicators
Absorption rate
Why it’s important
Carrying costs can push out your project’s break even point substantially. The market absorption rate offers a window into how substantial your carrying costs will be for your project. The absorption rate is calculated by dividing the total available space or available housing units by the average number of sales or space leased per month. In addition, absorption rates should also compensate for new construction and removal of existing space from the market, often due to physical depreciation. Absorption rates can also be used as a key indicator for developers considering new projects in an area.
Strengths/Weaknesses
Calculating residential inventory is an easier task than calculating commercial inventory. This creates more inherent risk in a commercial project. Due to less centralized records, absorption rate calculations can also overlook pre-sold homes and destruction of existing stock. In the event of a natural disaster, one’s knowledge of local conditions would enable a more thorough understanding of the impact on absorption rates. Absorption rates may also differ across different sub-geographies and price segments of the market. Therefore, it is critical to understand how substitute product may differ from the broader market absorption trends.
Resources
Your local multiple listing service will generally capture enough of the market to provide a clear view of absorption trends in the residential market. Various appraisal and brokerage firms also publish absorption rates online.
Total Inventory
Why it’s important
The number of housing units or square feet is a critical component in the supply and demand picture of a market. When combined with population, we get a good barometer of the supply/demand equilibrium or lack thereof.
Strengths/Weaknesses
Total inventory does provide a picture of deteriorating inventory or the pipeline of new inventory. It’s simply a snapshot of what’s in service today. The real value of this data is unlocked when used in tandem with population data; specifically projected changes in population. Any differential between these numbers can be compared with additions and subtractions from the total inventory to determine whether the future conditions will drive up prices due to undersupply or will drive prices down due to oversupply.
Resources
The US census conducts a study every other year called the American Housing Survey. It provides an estimate of total housing inventory, plus many other valuable data points for the professional real estate researcher.
Vacancy Rates
Why it’s important
Your vacancy rate will determine how long a space is empty between occupancies. Your effective vacancy rate will be determined by a number of factors, including: market conditions, pricing strategy, management policies and physical characteristics of the space. Key considerations during due diligence should include identifying the price at which rent revenue is maximized and degree to which the space is in demand for transient tenants. A transient tenant means more turnover and is generally less desirable.
Strengths/Weaknesses
While all properties have a “natural vacancy rate” (i.e. unoccupied time due to turnover), many of these factors are under control of the owner/manager. It’s important to understand which factors you have control over through effective management techniques and which must be acceptable as a condition of ownership. In fact, a high vacancy rate due to under-management can be a desirable characteristic to an investor, as that would indicate potential cash flow upside once they are able to apply their superior management acumen.
Resources
In addition to US census’ American Housing Survey, vacancy rates can be assessed by speaking with other owners and brokers in the area, as well as conducting research through the local MLS. Much can be uncovered about the vacancy rate for a particular property through the due diligence period.
Property Records
Site Evaluation/ Market Area Boundaries
When doing a site evaluation you have to evaluate multiple variables that affect and create the identity of the property being considered. In order to get an overall assessment of the site you need to consider it in correlation with it regional location, site location, physical characteristics, surrounding land use, access/ visibility, and proximity to services (grocers, retail, hospital, school).
Why is it important?
When searching for a site, part of the effort is to determine the market area boundaries for the project. Within the market area boundaries there is the Primary Market Area (PMA) – an area with complimentary uses and where the demand for new and specific products is expected to emanate. An example would be Brooklyn where the demand for office and residential use development has been high. Within those primary areas there are Competitive Market Areas (CMA), which are areas from which the subject site will compete on more or less equal basis. For example, if we were developing a residential project in Williamsburg, we would compete with multi-family communities in close proximity to our site and with similar physical and economical offering range.
Strength/ Weakness
It lays out the role that each function within a community has on the property. The correlation between the macro economical and financial indicators with the physical attributes of a site allows the investor to have a geographical understanding of the site and its relation with the surrounding properties within the CMA area and among different PMA areas in the metropolitan market where the site is located. There is a qualitative aspect in defining the market boundaries, which may make it difficult for you to determine how far are aboundires go. Especially as economical and technological advances bridge the gap between adjacent market and blurs the line between independence and reliance among between these markets.
Resources
2014 American Community Survey; US Census; Listing websites such as Zillow, Propertyshark. For market boundaries market reports from Costar and CBRE provide geographical maps of markets, cluster submarkets and individual submarkets.
Property Records
Why is it important?
When evaluating different real estate opportunities it is important to obtain detailed property information. You can obtain this information by researching municipal property records. County recorder’s office keeps property records and property tax maps. Property records include the history of the property such as title transfers, deeds, mortgages and liens. Tax records include parcel features, physical attributes and current property assessment value. This information will help the investor to come closer to a decision based on accurate ownership and legal standing of the site.
Strengths/Weaknesses
Municipality records give an accurate track record of the property and it is an important step in the due diligence process and verification of information. It helps the investor understand if there are claims against the property and if there are any outstanding tax payments. However, if you decide to make an offer on the property, you would need to engage outside consultants and title insurance providers in order to ensure protection against liabilities caused by the previous owner.
Resources
You will be able to access this information through the website of the respective municipality and county.
Transportation
Transportation
Why is it important?
Transportation creates an inherent value for a property. The more linkages to transportation a site has, the more inherently valuable is that site. The transportation links could consist of walking, bicycling, car driving, train, and airport. Access and proximity to these links promotes convenience and creates value for residential properties that seek high rents, for office spaces seek talent and retail to determine prime locations.
Strengths/Weaknesses
Transportation data will help you understand opportunity cost that your customer is willing to forgo in order to travel between locations. I Residential rents will be lower when the commute to and from the place takes longer and when access point are few. An office tenant will likely move less if it is easily accessible for their employees. A retail center is more likely to open at an intersection that has access to multiple linkages.
Resources
The Bureau of Transportation Statistics and Longitudinal Employer – Household Dynamics, US Census Bureau are excellent resources to explore transportation topics and it provides information about the infrastructure of the system, commuter time, system performance, traffic count For NYC, good traffic sources include the NY Department of Transportation , NYC Future by Cart, NYC DOT.